Document AI · CAD-to-BIM · Instance segmentation
CAD-to-BIM AI: structural drawing understanding
Detecting and segmenting columns, beams, walls, openings and piles on structural plans, so that 2D drawings become structured element data for CAD-to-BIM modelling.
- Context
- AGECS (R&D, remote)
- Period
- Apr 2026 – present
- My role
- R&D engineer: dataset engineering, training, error analysis, post-processing
- 0.941
- Column mAP50 (box & mask)
- YOLOv8m-seg · P 0.944 · R 0.935
- 0.902
- 8-class val box mAP50
- mask mAP50 0.893 · best epoch 13
- 21,009
- Training tiles
- 2,516 val · 2,569 test
- 209,504
- Wall instances unified
- plus 1,734 beams, 6 sources
Chapter 01
The engineering challenge
Structural sheets are huge (up to 15,000 × 12,000 px). Elements are thin and repetitive, and they are easily confused with text, hatching and dimension lines.
Public labelled data is scattered across formats (COCO JSON, YOLO, SVG, custom schemas), and some of it has corrupt or inconsistent annotations.
Chapter 02
Input data
Public plan datasets
Structural and architectural plans in COCO, YOLO and SVG formats
Unified training set
21,009 / 2,516 / 2,569 tiles, 8 element classes
Annotated project sheets
QA'd in CVAT: labels bound to their elements
Chapter 03
The AI & engineering workflow
Stage 1 of 5
Unify data
COCO / YOLO / SVG → one schema, audited and hash-verified
What I did
- Audited five structural and floor-plan data sources (~22k files). I wrote SVG→COCO and rect→COCO converters and MD5-verified every copy against source.
- Built a building-level train/val/test split to prevent leakage, plus copy-paste augmentation for rare circular columns.
- Trained a YOLOv8m-seg column model on 640 px tiles within a 4 GB GPU budget. I diagnosed EMA NaNs caused by VRAM overflow and moved from the L model to the M model.
- Engineered inference: 30% tile overlap, 4-rotation test-time augmentation with verified inverse transforms, global NMS, and pixel-evidence checks that reject text blobs and linework.
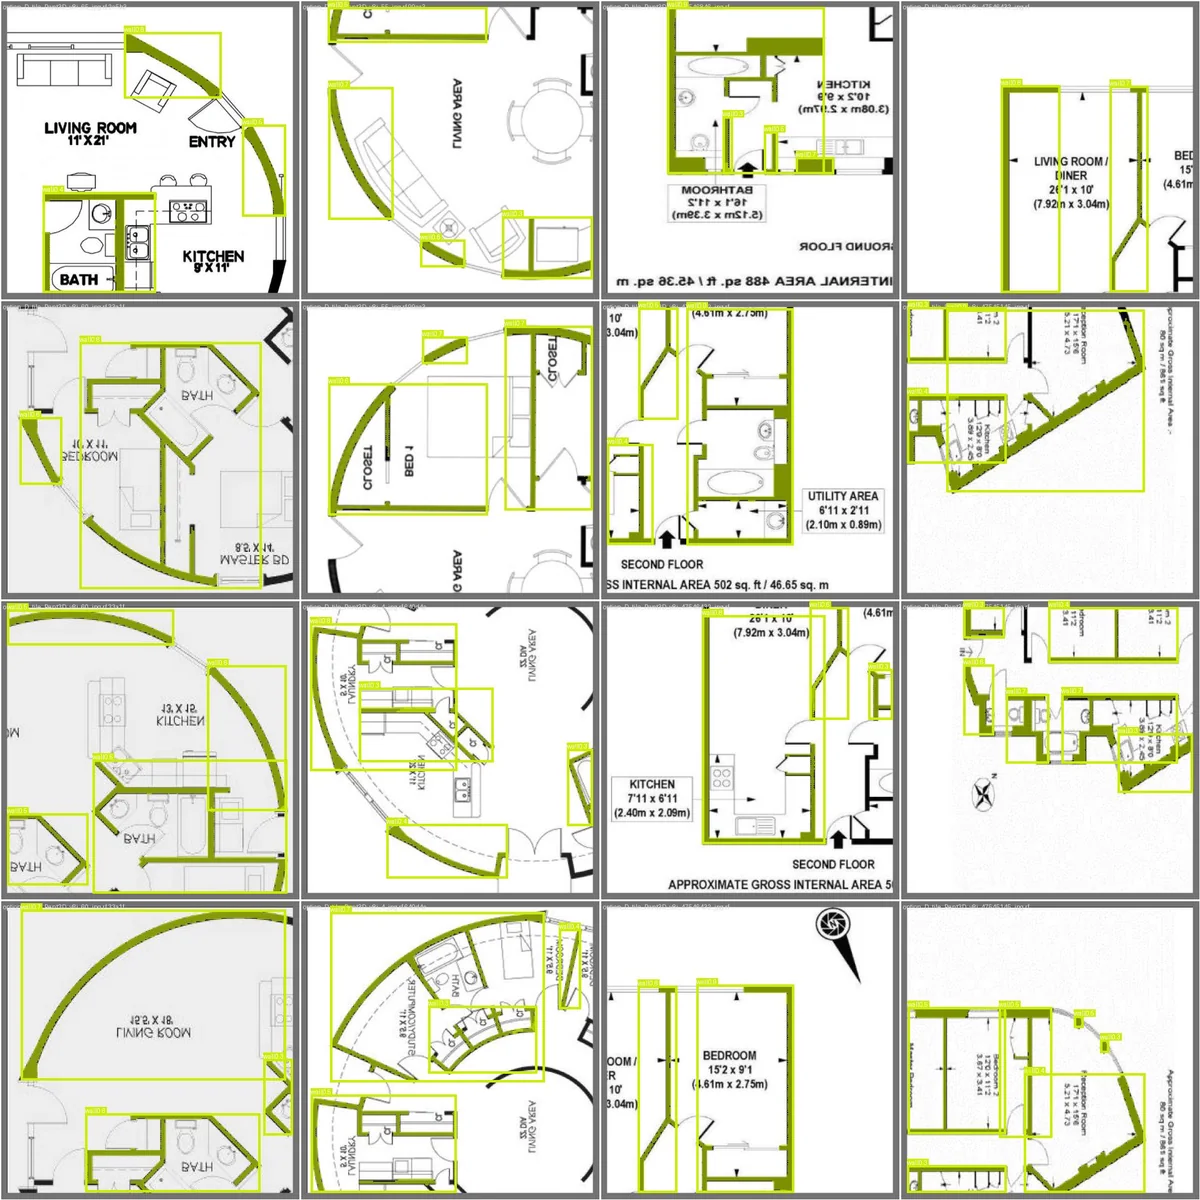
- Scaled to an 8-class structural-element model (~21k training tiles) and a CV-to-CAD mapping so detections carry drawing coordinates.
- Annotated and QA'd real project sheets in CVAT. On one steel sheet I added 251 verified instances and 918 polygon vertices, binding each beam label to its beam.
CAD-to-BIM
Three plans in, one 3D model out.
The AI reads the foundation, level 1 and roof plans, detects each structural element, and the detections are built level by level on top of the plans.

Real plans (public BLD-ST dataset) and real model predictions. Plans stacked one storey apart; the 3D is a simple extrusion of the detections.
Input → output
Drag to compare.
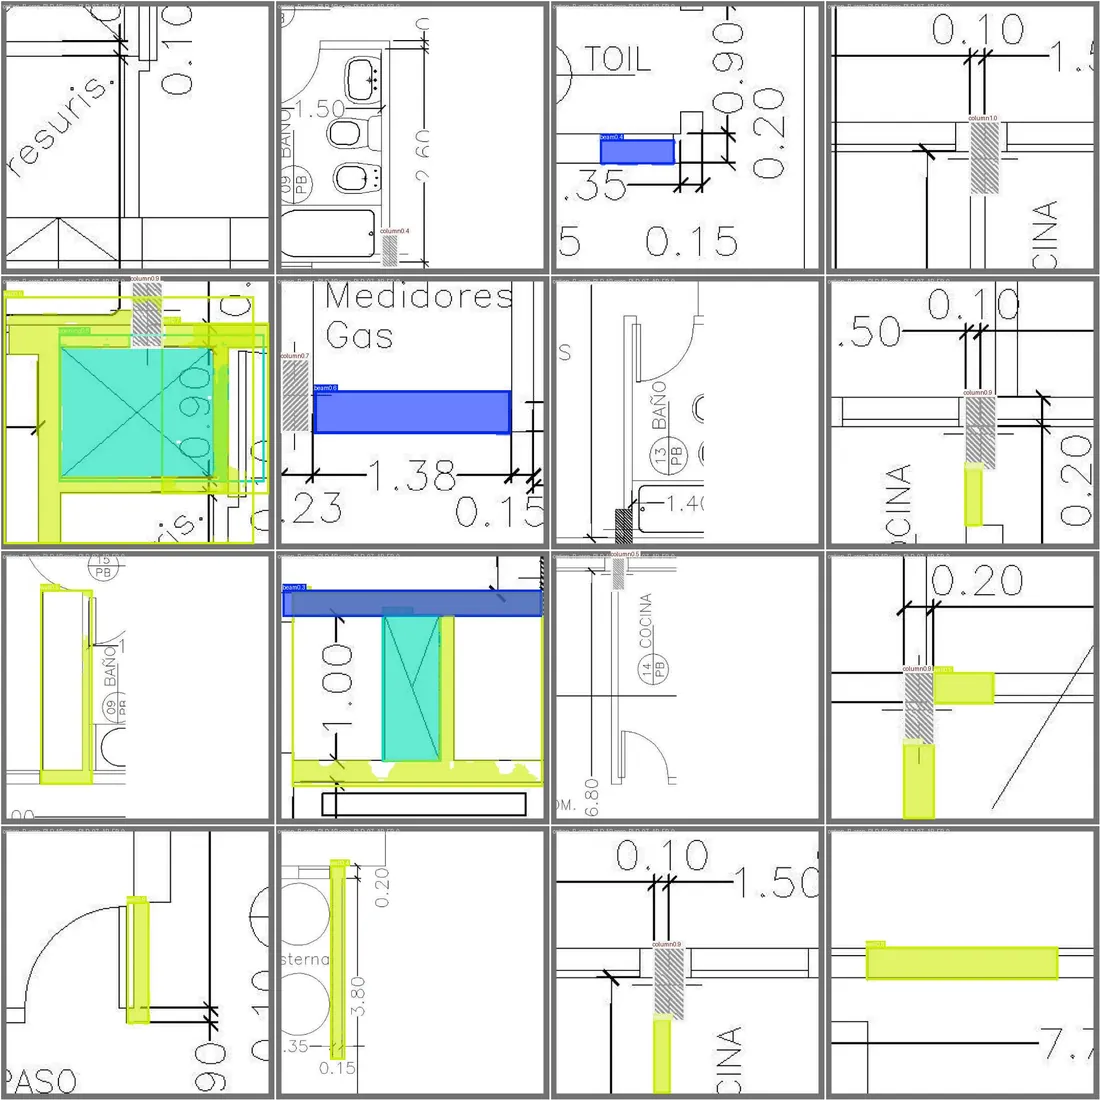
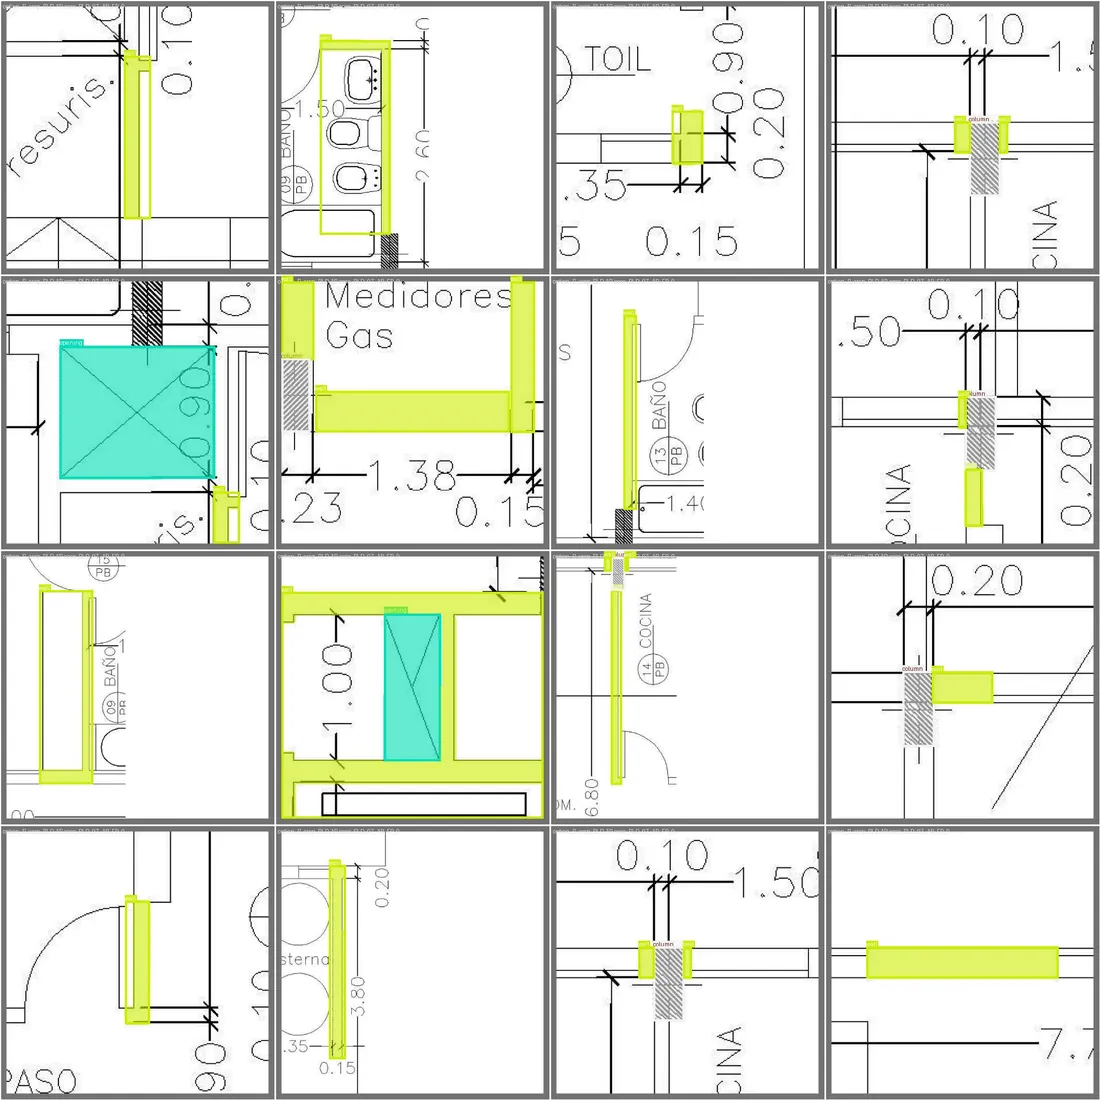
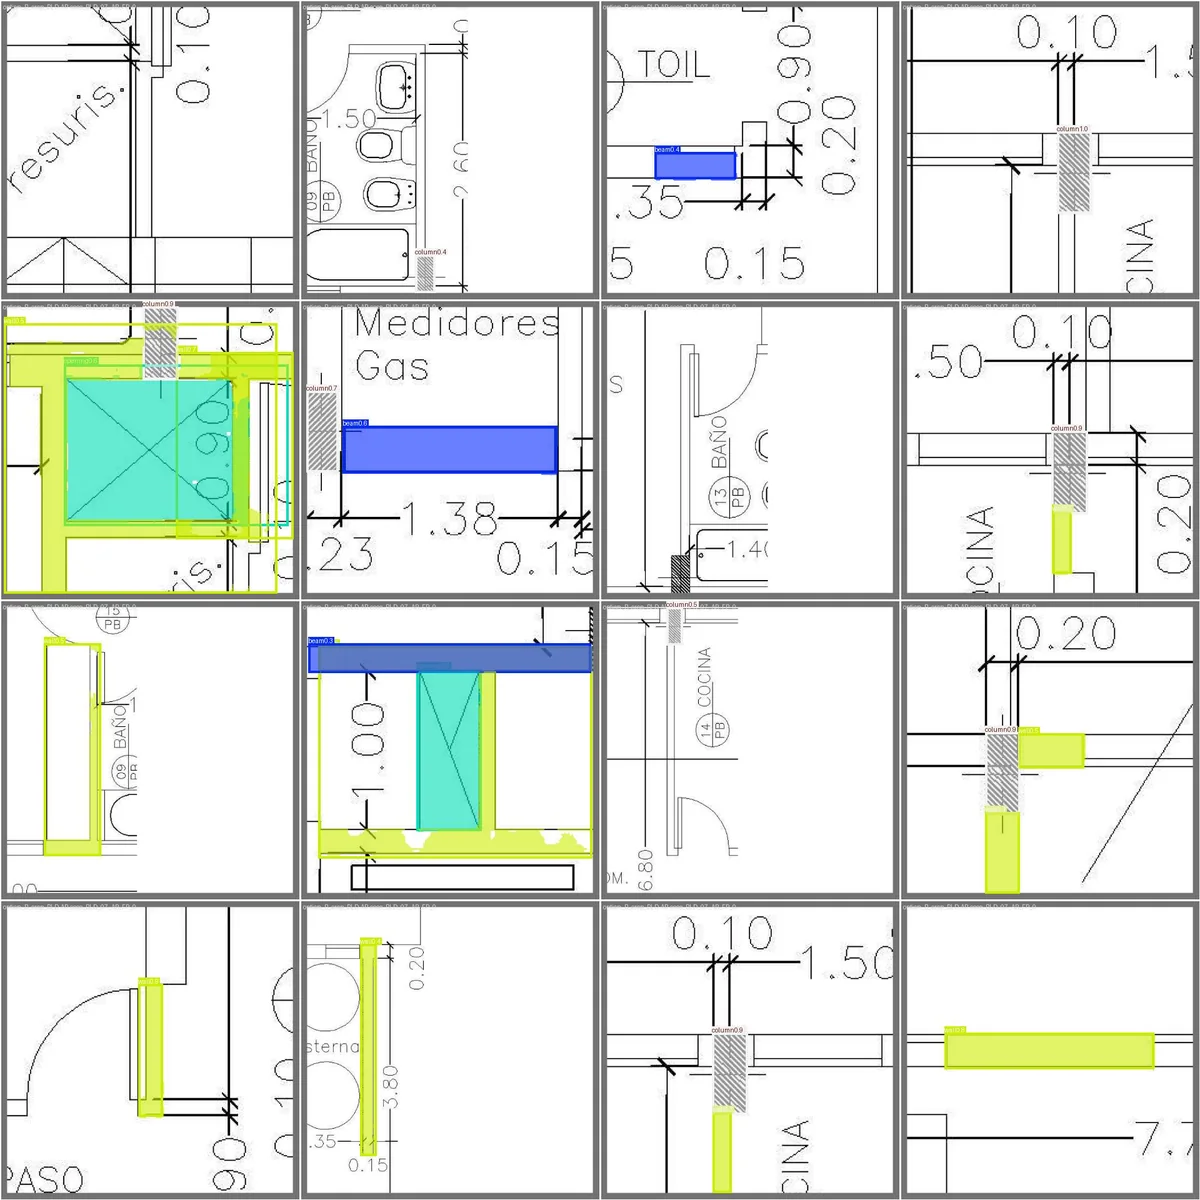
Validation tiles from public floor-plan datasets: annotated elements vs the 8-class model's masks. Drag to compare.
Chapter 04
Technical result
- The column detector exceeded its mAP50 > 0.80 target by a wide margin (0.941 box and mask, precision 0.944, recall 0.935).
- The 8-class model reached 0.902 box / 0.893 mask mAP50 on validation, with high test reliability for openings and beams.
- Error analysis showed column recall and piles are the gap. The fix is more labelled real sheets, which I am producing through a QA'd annotation stream.
8-class model: validation mAP50 by epoch
Box and mask curves track closely: masks are as reliable as boxes.
- Box mAP50
- Mask mAP50
View data table
| Epoch | Box mAP50 | Mask mAP50 |
|---|---|---|
| 1 | 0.691 | 0.403 |
| 2 | 0.781 | 0.697 |
| 3 | 0.797 | 0.786 |
| 4 | 0.822 | 0.822 |
| 5 | 0.834 | 0.832 |
| 6 | 0.855 | 0.853 |
| 7 | 0.857 | 0.854 |
| 8 | 0.874 | 0.861 |
| 9 | 0.870 | 0.864 |
| 10 | 0.862 | 0.856 |
| 11 | 0.884 | 0.882 |
| 12 | 0.872 | 0.862 |
| 13 | 0.902 | 0.893 |
| 14 | 0.889 | 0.884 |
| 15 | 0.883 | 0.877 |
| 16 | 0.886 | 0.881 |
| 17 | 0.877 | 0.870 |
| 18 | 0.873 | 0.868 |
| 19 | 0.880 | 0.872 |
| 20 | 0.879 | 0.868 |
Source: AGECS 8-class training log
Held-out test mask mAP50 by element
Where the model is reliable, and where more data is needed.
- Mask mAP50
- Box mAP50
Column recall on the test split (0.51) is the weak point. Steel members and walls had no scorable test instances in this run.
View data table
| Category | Mask mAP50 | Box mAP50 |
|---|---|---|
| Opening | 0.977 | 0.977 |
| Beam | 0.943 | 0.904 |
| Column | 0.625 | 0.625 |
| Pile | 0.624 | 0.611 |
Source: AGECS 8-class test metrics
Limitations, stated plainly
- Client project sheets were used for training and annotation. They are not shown here. All tiles shown come from public floor-plan datasets.
Outputs & artefacts
Chapter 05
Practical impact & relevance
- Turns drawings into data, the step that 2D-to-3D, quantity take-off and BIM automation all depend on.
- Shows production habits: leakage-safe splits, verified data provenance, reproducible notebooks and documented failure modes.
EvidenceWhere every figure on this page comes from
Each metric is taken from a primary record, not from a CV. Hover a metric to see its source. The underlying files are available for review at interview.
- AGECS column-detection training log
- AGECS column-detection pipeline record
- AGECS dataset-engineering log
- AGECS training outputs
- AGECS annotation QA report
Shown at the level of aggregate metrics and public-dataset imagery. No client drawings are reproduced.
Next case study
Scan-to-BIM: point cloud to verified IFC