Digital twin · BIM + ML · Industry project
Crack detection to digital twin: concrete water tank
A concept workflow linking crack detection, Eurocode-based width classification and a Revit model inside Power BI, so engineers can triage tank condition remotely.
- Context
- AECOM × Ulster University industry project (BEN715)
- Period
- Feb – May 2025
- My role
- Project lead (individual): scoping with AECOM, Revit modelling, ML, dashboards
- 70.0%
- VGG16 crack classifier
- saved run, 30 test images · 89.69% in the submitted report
- 36.67%
- Baseline custom CNN
- first attempt: over-fitted
- 0.3 mm
- EN 1992 w_max threshold used
- Table 7.1N, exposure XC2
- 80%
- Module mark
- BEN715 Industry Project
Chapter 01
The engineering challenge
Cracks in concrete water tanks cause leakage and deterioration. Tanks are often remote or difficult to access, which makes manual inspection slow and hazardous.
AECOM framed the problem at the kick-off meeting: connect inspection evidence to the asset model and to maintenance decisions.
Chapter 02
Input data
AECOM drawings
2D drawings of the tank, modelled in Revit
Crack images
Public RC-wall crack datasets (Mendeley, Utah State), 80/10/10 split
Design standard
EN 1992-1-1 Table 7.1N crack-width limits
Chapter 03
The AI & engineering workflow
Stage 1 of 5
Model
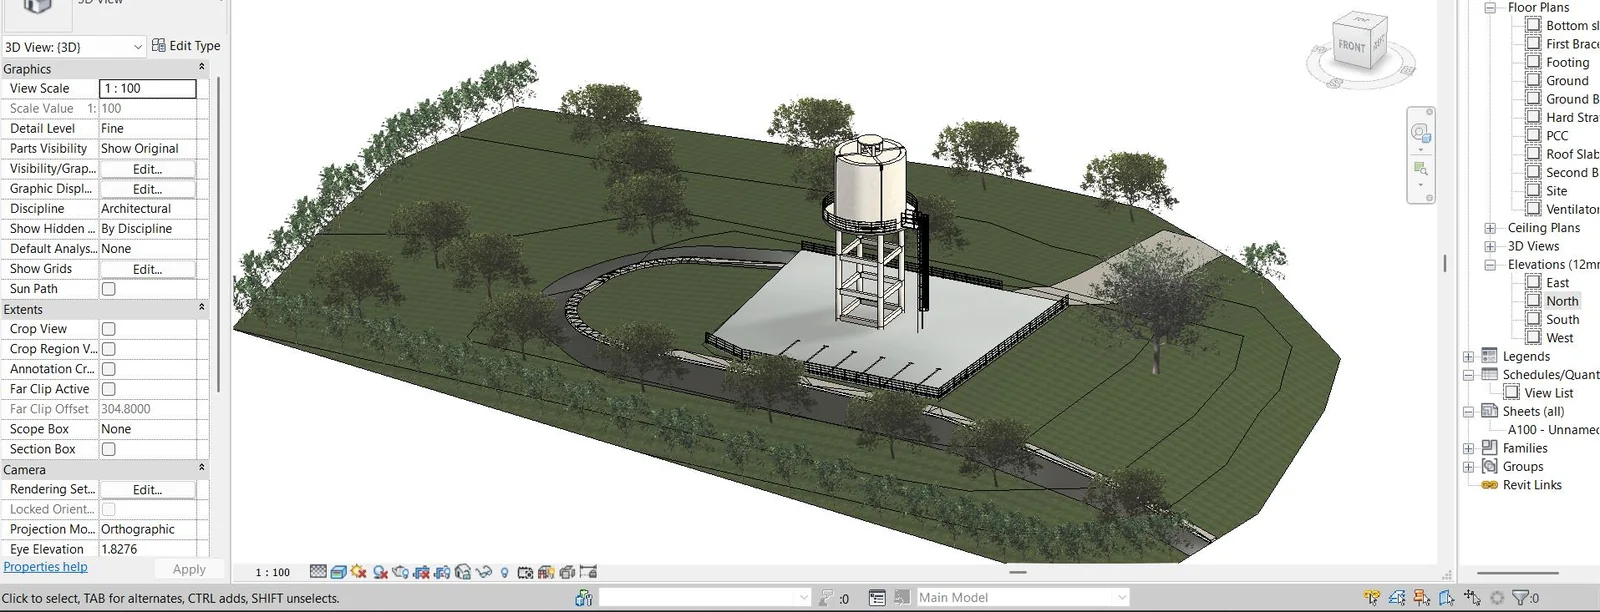
2D drawings → Revit → IFC
What I did
- Built a Revit model from AECOM's 2D drawings, exported it to IFC, and linked crack data back into Revit with Dynamo.
- Trained a crack classifier. A first custom CNN over-fitted (36.67% test accuracy); a pretrained VGG16 reached 70.0% on the saved 30-image test run (89.69% reported in the submitted report).
- Estimated crack width from masks and classified it against EN 1992-1-1 Table 7.1N (w_max 0.3 mm, XC2) to assign a maintenance action.
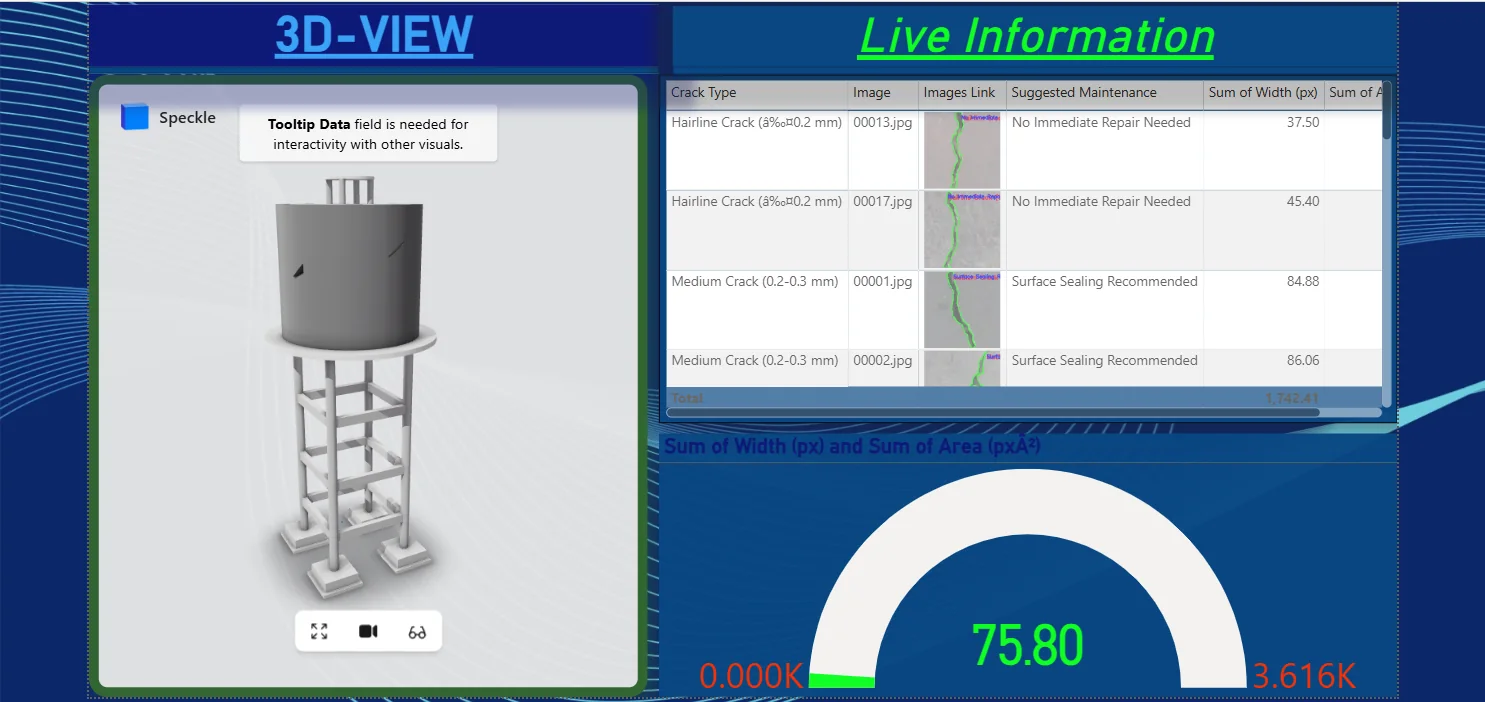
- Moved visualisation from a browser IFC viewer, which failed on complex BIM files, to Power BI with an embedded 3D Revit visual, a crack table and a mobile layout.
Input → output
Drag to compare.
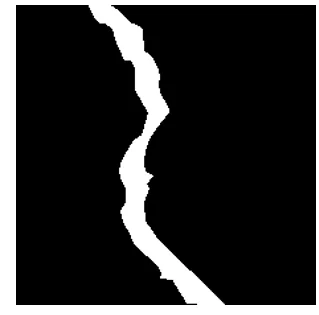
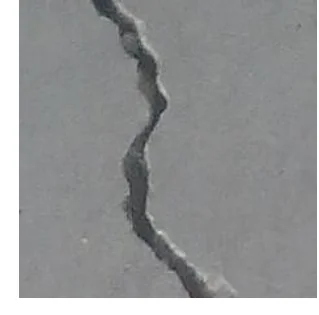
Training pair from a public RC crack dataset: the photograph and the binary mask used to estimate crack width.
Chapter 04
Technical result
- Delivered a working prototype. Detected cracks are classified, carry a recommended maintenance action, and are visible on the 3D asset in Power BI.
- Recorded an evidence-based lesson on tool choice: lightweight browser IFC viewers could not handle the model, and Power BI with a 3D visual could.
Limitations, stated plainly
- No camera was installed on site. The live-camera and cloud stages are a proposed architecture, and the report says so.
- Training images came from public crack datasets (Mendeley, Utah State University), not from the tank itself. They carry no physical scale, so the mm widths rely on an assumed calibration.
- The submitted report states 89.69% for VGG16; the last saved notebook run shows 70.0% on 30 test images. Both are published in the repository.
Outputs & artefacts
Chapter 05
Practical impact & relevance
- Bridges the structural standard (crack-width limits) with data science and BIM, which is the kind of problem digital-delivery teams bring to consultants.
EvidenceWhere every figure on this page comes from
Each metric is taken from a primary record, not from a CV. Hover a metric to see its source. The underlying files are available for review at interview.
- BEN715 industry-project report (AECOM × Ulster, 2025)
- BEN715 project files: Revit, Dynamo, Power BI
- BEN715 dashboard captures
Next case study
BIM coordination & automation: The Brinell Building